Quality Analysis
Read quality scores
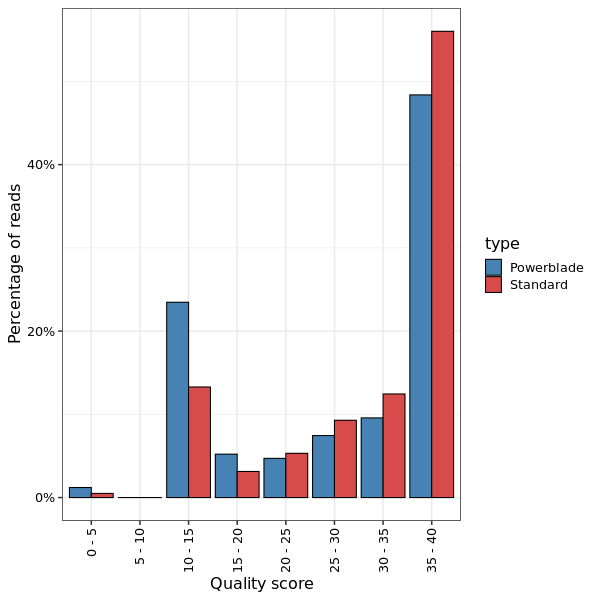
This shows a histogram of the the overall quality scores for reads.
Base quality scores
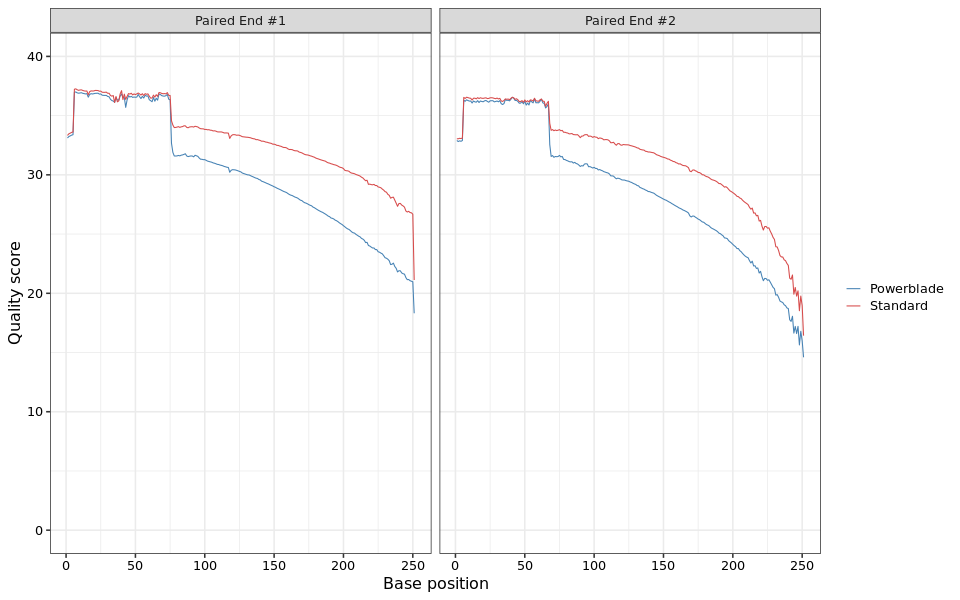
This lineplot shows the average quality score at each base along the read.
Standard Tasks
GC content
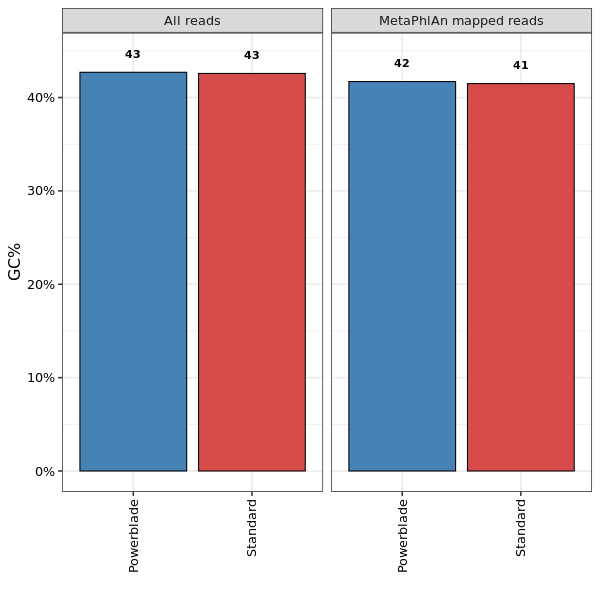
This shows the GC content in all reads (left) and reads that aligned to MetaPhlAn markers (right).
MetaPhlAn genus abundance
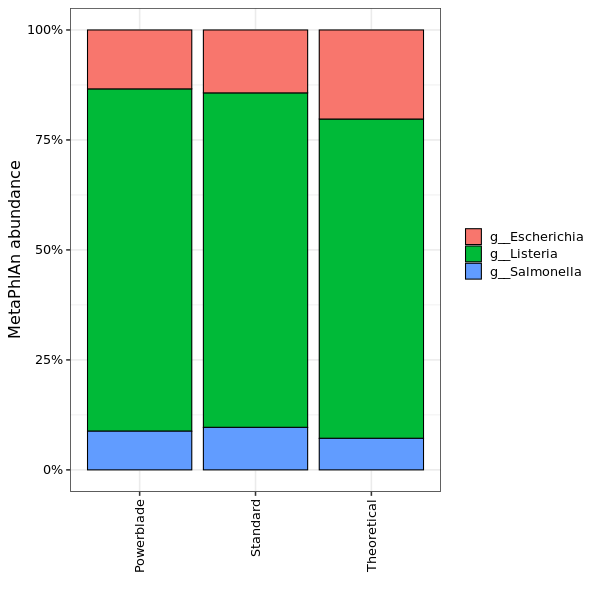
The abundance of different genera as estimated by MetaPhlAn
MetaPhlAn species abundance
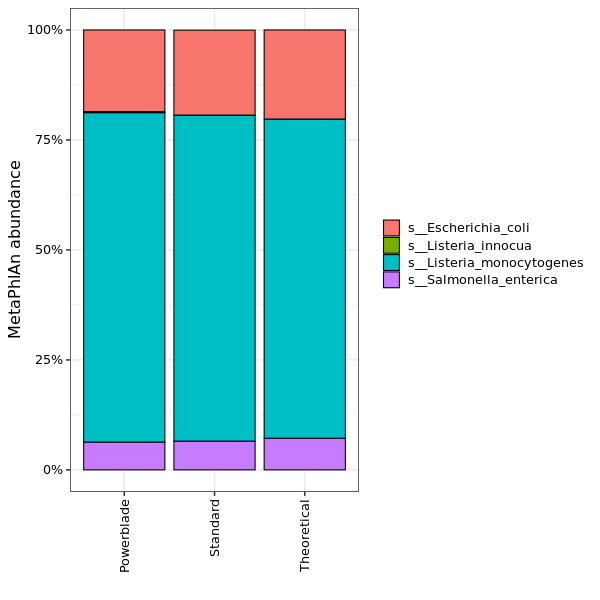
The abundance of different species as estimated by MetaPhlAn
Assembly
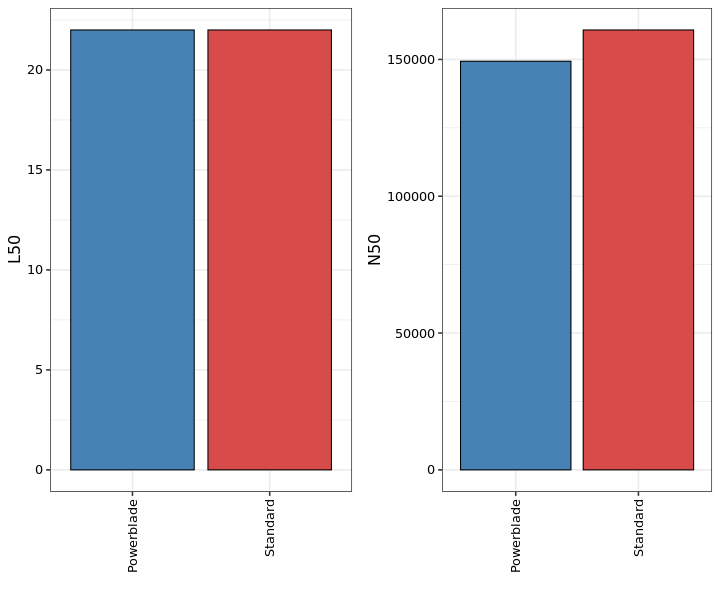
Performance of genome assemblies with spades. L50 is the number of contigs required for 50% of the assembled genome. N50 is a weighted median of the contig sizes, meaning that 50% of the genome is contained in contigs larger than this size.
Strain Analysis

A phylogenetic tree of Listeria monocytogenes strains, combined from NCBI and assembled from our sequencing data.
SNPs
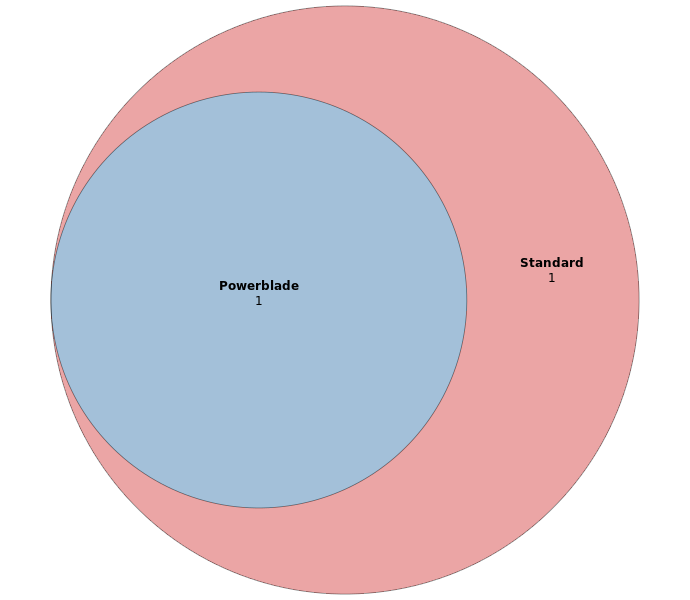
The overlap between Listeria monocytogenes SNPs identified with either the powerblade or the standard library preparation.
Genome Coverage
Reference aligned data
Coverage along the reference genome.
Strain aligned data
Coverage along the genome of the sequenced strain. The strains are E. coli O157EDL933, L. monocytogenes 4b str. 02-1289 and S. enterica ATCC14028
Strain aligned data with SNPs
Coverage along the genome of the sequenced strain. The dots represent SNPs that are unique to one method or the other. Hover over to see the number of SNPs. The strains are E. coli O157EDL933, L. monocytogenes 4b str. 02-1289 and S. enterica ATCC14028
Coverage and GC content relationship
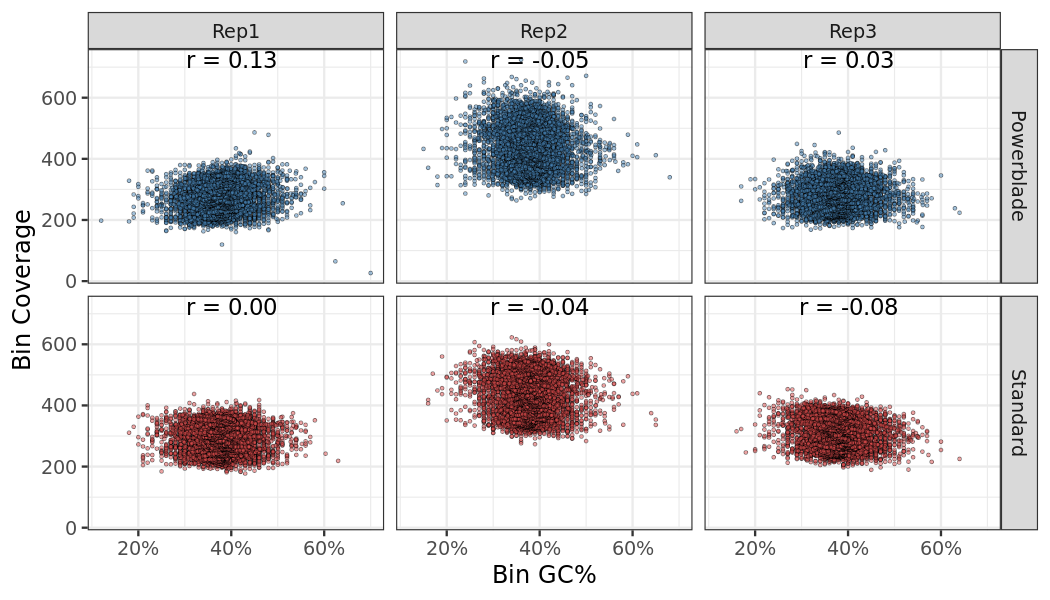
The correlation between coverage and GC content in 1000 bins along the genome. A bin needs a minimum average coverage of 10 to be considered.
Genome coverage PCA
This graph shows batch effects in the relationship between GC content and sequencing depth. Different sequencing runs will have a different correlation between GC content and sequencing depth. This graph splits the genome into bins, which vary in GC content, normalizes the sequencing depth and then uses PCA to visualize these batch effects.